Vacation Rental Pricing Strategy: Data-Driven Optimization
Pricing is the single most important factor in vacation rental revenue. Pricing 10% too low costs you $8,000-15,000 annually. Pricing 10% too high costs you bookings. Getting pricing right is complex, but it’s also where big money gets made.
This guide covers the data-driven approach to vacation rental pricing—the same approach we use to optimize our properties and grow owner revenue.
UNDERSTANDING VALUE VS. PRICE
The Psychology of Vacation Rental Pricing
Price ≠ Value:
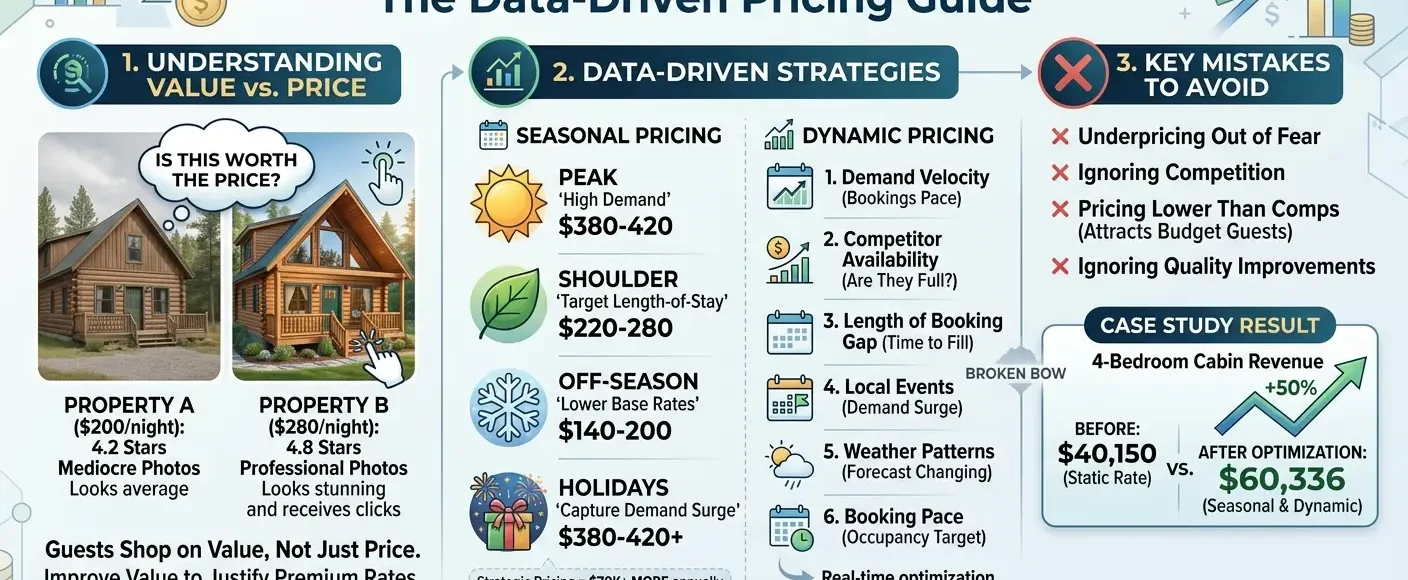
Guests don’t shop on price alone. They shop on value. A $300/night cabin with professional photos and 4.9-star reviews commands premium positioning. A $150/night cabin with mediocre photos and 3.8-star reviews struggles.
Value Drivers:
- Professional photography (justifies premium pricing)
- Strong reviews (justifies premium pricing)
- Unique amenities (justifies premium pricing)
- Exceptional guest experience (justifies premium pricing)
- Desirable location (justifies premium pricing)
Pricing Psychology:
Guests ask: “Is this worth the price?”
Not: “Is this the cheapest option?”
A guest choosing between:
- Property A: $200/night, 4.2 stars, mediocre photos
- Property B: $280/night, 4.8 stars, professional photos
Will often choose Property B because it appears better value despite higher price.
Implication:
Increasing rates without improving value = fewer bookings
Improving value and increasing rates = same/more bookings at higher revenue
This is the goal of optimization.
COMPETITIVE ANALYSIS
What Your Competitors Are Charging
Step 1: Identify Direct Competitors
Find 5-10 properties like yours in your market:
- Similar size (bedrooms)
- Similar amenities
- Similar quality
- Similar location
For Broken Bow: Search Airbnb + VRBO for “Broken Bow cabin 4-bedroom” to find direct comps.
Step 2: Price Collection
Document each competitor’s rates:
- Nightly rate (weekday vs. weekend)
- Seasonal variation
- Minimum night requirements
- Special pricing (holidays, events)
| Property | Size | Amenities | Weekday | Weekend | Holiday | Rating | Occupancy |
| Comp 1 | 4-bed | hot tub | $250 | $320 | $400 | 4.8 | high |
| Comp 2 | 4-bed | fireplace | $200 | $280 | $350 | 4.2 | medium |
Step 3: Pricing Analysis
Analyze what competitors charge and why:
- High performers (4.8+ stars): Pricing range
- Medium performers (4.2-4.8 stars): Pricing range
- Low performers (below 4.2 stars): Pricing range
Pattern emerges: Better reviewed properties command higher prices.
Step 4: Identify Your Position
Where does your property fit?
- Similar to high performer? → Charge similar rate
- Similar to medium performer? → Charge medium rate + improvement plan
- Similar to low performer? → Lower rate until ratings improve
Step 5: Monitor & Adjust
Competitors adjust pricing. Monitor their changes:
- Pricing increases/decreases
- Seasonal patterns
- Special promotions
- Holiday strategies
Your pricing stays competitive by monitoring theirs.
SEASONAL PRICING STRATEGY
Optimizing Rates by Season
Peak Season (Summer, Holidays):
When: June-August, Thanksgiving, Christmas/New Year
What’s happening:
- Families on vacation
- Schools are out
- Weather is best
- Demand is highest
Pricing strategy:
- Maximize rates to ceiling of market
- Premium positioning
- High booking velocity
- Near 100% occupancy possible
Example property ($200 standard rate):
- Standard rate: $250/night
- Peak season: $380-420/night
- Occupancy: 95%+
Result: Highest revenue months
Shoulder Seasons (Spring/Fall):
When: April-May, September-October
What’s happening:
- Work is resuming (post-spring, back-to-school)
- Weather still good
- Moderate demand
- Better for budget-conscious travelers
Pricing strategy:
- Moderate rates with strategic discounts
- Target length-of-stay bookings
- Promotional offers to fill calendar
- 70-80% occupancy target
Example property ($200 standard rate):
- Weekday rate: $220/night
- Weekend rate: $280/night
- 7-night discount: -5% = $209/night
- Occupancy target: 75%
Result: Good revenue, consistent bookings
Off-Season (Winter, off-peak):
When: January-March, November
What’s happening:
- Post-holiday return to normal
- Weather less attractive
- Lowest demand
- Budget travelers, remote workers
Pricing strategy:
- Lower base rates
- Deep discounts for weekly bookings
- Focus on special events (weekends)
- Maintenance window
- Build anticipation
Example property ($200 standard rate):
- Weekday rate: $140/night
- Weekend rate: $200/night
- 7-night discount: $130/night
- Occupancy target: 40-50%
Result: Lower revenue but maintains occupancy
Holiday Windows (Special Events):
When: Thanksgiving, Christmas/New Year, Valentine’s Day, Easter
What’s happening:
- Families planning ahead
- Limited availability nearby
- Premium pricing tolerated
- Can book 2-3 months in advance
Pricing strategy:
- Premium pricing 30-50% above standard
- Book in advance to capture demand
- Strict cancellation policies
- Nearly 100% occupancy possible
Example property ($200 standard rate):
- Christmas week: $420/night
- Thanksgiving: $380/night
- Occupancy: 100%
Result: Exceptional revenue concentration
Seasonal Pricing Example: Full Year Calendar
4-bedroom cabin, $200 base rate:
- January: $140 weekday, $200 weekend
- February: $140 weekday, $200 weekend
- March: $160 weekday, $220 weekend (Spring Break)
- April: $220 weekday, $280 weekend (Shoulder)
- May: $240 weekday, $310 weekend (Shoulder)
- June: $340 weekday, $380 weekend (Peak)
- July: $360 weekday, $420 weekend (Peak)
- August: $350 weekday, $400 weekend (Peak)
- September: $240 weekday, $300 weekend (Shoulder)
- October: $240 weekday, $310 weekend (Shoulder)
- November: $160 weekday, $240 weekend (Thanksgiving)
- December: $200 weekday, $340 weekend + $420 (Christmas week)
Annual revenue at this pricing: Estimated $140K-160K+
**Compare to static $200/night:** ~$73K annually
Difference: $70K+ annually from strategic seasonal pricing
DYNAMIC PRICING APPROACH
Real-Time Market Optimization
Beyond Seasonal Pricing:
Seasonal pricing is step one. Dynamic pricing is advanced optimization. Dynamic pricing adjusts rates based on real-time market factors:
Factors That Influence Dynamic Pricing:
- Demand Velocity:
- How many inquiries are you getting?
- How far in advance are bookings?
- How fast is calendar filling?
- If inquiries exceeding availability → raise rates
- If inquiries slow → lower rates or promote
- Competitor Availability:
- Are competitors available when you are?
- Are competitors booked while you’re available?
- If most competitors booked → raise rates
- If competitors available → lower rates or differentiate
- Length of Booking Gap:
- What dates are open?
- How far from booking date?
- If opening is 60+ days away → lower rates to drive demand
- If opening is 10 days away → raise rates (urgency)
- Local Events:
- Is there a festival in town?
- Are local schools on break?
- Is there a special event nearby?
- If major event → raise rates (demand surge)
- If event ends → lower rates back to normal
- Weather Patterns:
- What’s the weather forecast?
- Are seasons changing?
- If great weather coming → raise rates
- If bad weather forecast → lower rates
- Booking Pace:
- Are you on pace for 70%+ occupancy?
- Are you on pace for lower occupancy?
- If on pace for >80% → raise rates (fill high)
- If on pace for <50% → lower rates (fill gaps)
Dynamic Pricing Implementation:
Tools available:
- Channel management software (Airbnb, VRBO native tools)
- Dedicated pricing software (Wheelhouse, PriceLabs, etc.)
- Manual analysis (spreadsheet, historical data)
Frequency:
- Weekly review minimum
- Daily adjustment if needed
- Real-time adjustments for special events
Process:
- Analyze factors above
- Determine if rates should increase/decrease
- Adjust rates on all platforms
- Monitor results
- Refine next week
OCCUPANCY VS. REVENUE OPTIMIZATION
Don’t Confuse Occupancy Rate With Revenue
Common Mistake:
“I just want to fill my calendar” → Wrong goal
Correct goal: “I want to maximize revenue”
These are sometimes different.
Example:
- Pricing Strategy A:
- Rate: $150/night
- Occupancy: 90%
- Annual revenue: $49,275
- Pricing Strategy B:
- Rate: $220/night
- Occupancy: 75%
- Annual revenue: $60,225
Strategy B has LOWER occupancy but HIGHER revenue. Occupancy rate is not your goal. Revenue is your goal.
When Lower Occupancy = Higher Revenue:
If you can increase your nightly rate by 50% while losing only 15% of occupancy, that’s a win.
The math:
- Current: $200/night × 75% occupancy = Revenue
- New: $300/night × 65% occupancy = Higher Revenue
Test rate increases and monitor booking pace. Often you’ll find you can increase rates without proportional occupancy loss.
COMMON PRICING MISTAKES
Pricing Errors That Cost Thousands
Mistake #1: Underpricing Out of Fear
Thinking: “If I charge too much, nobody will book.”
Reality: Your market has a ceiling. Charge less than ceiling and you leave money on table.
Fix: Test rate increases. Monitor booking pace. You’ll find the sweet spot.
Mistake #2: Not Adjusting Seasonally
Thinking: “It’s easier to charge the same rate all year.”
Reality: Summer has 10x demand of winter. Seasonal pricing increases revenue 30-50%.
Fix: Implement clear seasonal pricing. Summer up, winter down.
Mistake #3: Ignoring Your Competition
Thinking: “I’ll just charge what feels right.”
Reality: Your comps set market expectations. Charge way above them without reason = fewer bookings.
Fix: Monitor comps monthly. Position yourself competitively based on quality.
Mistake #4: Pricing Lower Than Competition
Thinking: “Lower price will get more bookings.”
Reality: Lower price attracts budget guests who leave bad reviews. You get MORE bookings but LOWER revenue and WORSE reviews.
Fix: Price competitively based on your quality. Compete on experience, not price.
Mistake #5: Not Adjusting for Quality Improvements
Thinking: “I’ll raise rates after I get some bookings.”
Reality: You should raise rates as quality improves (better photos, higher ratings, new amenities).
Fix: Monitor your improvement and adjust pricing accordingly.
CASE STUDY
Real Property Pricing Optimization
Property: 4-bedroom Broken Bow cabin
Starting Point:
- Rate: $200/night (static, same all year)
- Occupancy: 55%
- Rating: 4.1 stars
- Annual revenue: $40,150
Optimization Implemented:
- Month 1-2: Photography refresh + review management
- Improved photos
- Responded to reviews
- Rating: 4.3 stars
- Month 3-4: Seasonal pricing
- Summer: $280/night
- Shoulder: $220/night
- Winter: $140/night
- Off-season cleanup
- Month 5+: Dynamic adjustments
- Monitor demand
- Real-time rate adjustments
- Event-based pricing
- Competitor monitoring
Results After 12 Months:
- Average rate: $230/night (up from $200)
- Occupancy: 72% (up from 55%)
- Rating: 4.7 stars (up from 4.1)
- Annual revenue: $60,336
Revenue increase: $20,186 annually (+50%)
Cost of optimization: ~$2,000 in photography + software
ROI: Paid for itself in 1 month, +$18K pure profit annually going forward
Pricing Strategy Requires Expert Analysis
Pricing optimization isn’t complicated, but it requires data analysis and market understanding. The difference between good pricing and optimal pricing is $20K-30K annually.
That’s why professional management focuses heavily on pricing strategy.